MLB Closing Line Value: CLV Calculations and Tracking
 Available in US
Table of Contents
- MLB CLV Tracking: Evaluating Odds at First Pitch
- What CLV Actually Means in an MLB Context
- Why CLV Matters More Than Win Percentage Over a 162-Game Season
- How to Calculate CLV: The Math Is Simpler Than You Think
- Typical MLB Line-Movement Patterns You Can Read
- Building a CLV Tracking Sheet That Tells You Something Useful
- What Positive CLV Looks Like – and What to Do With It

MLB CLV Tracking: Evaluating Odds at First Pitch
The first time a senior trader at a UK book pulled me aside and said “stop telling me how you finished the month, tell me your closing-line value,” I assumed he was being clever. He was not. He was telling me the only thing that mattered. A bettor who consistently beats the close has a long-term edge. A bettor who does not, but is up for the month, is on a hot streak that the math will eventually correct. That conversation rewired how I evaluated my own results, and ten years later I still treat CLV as the single most honest metric in baseball betting.
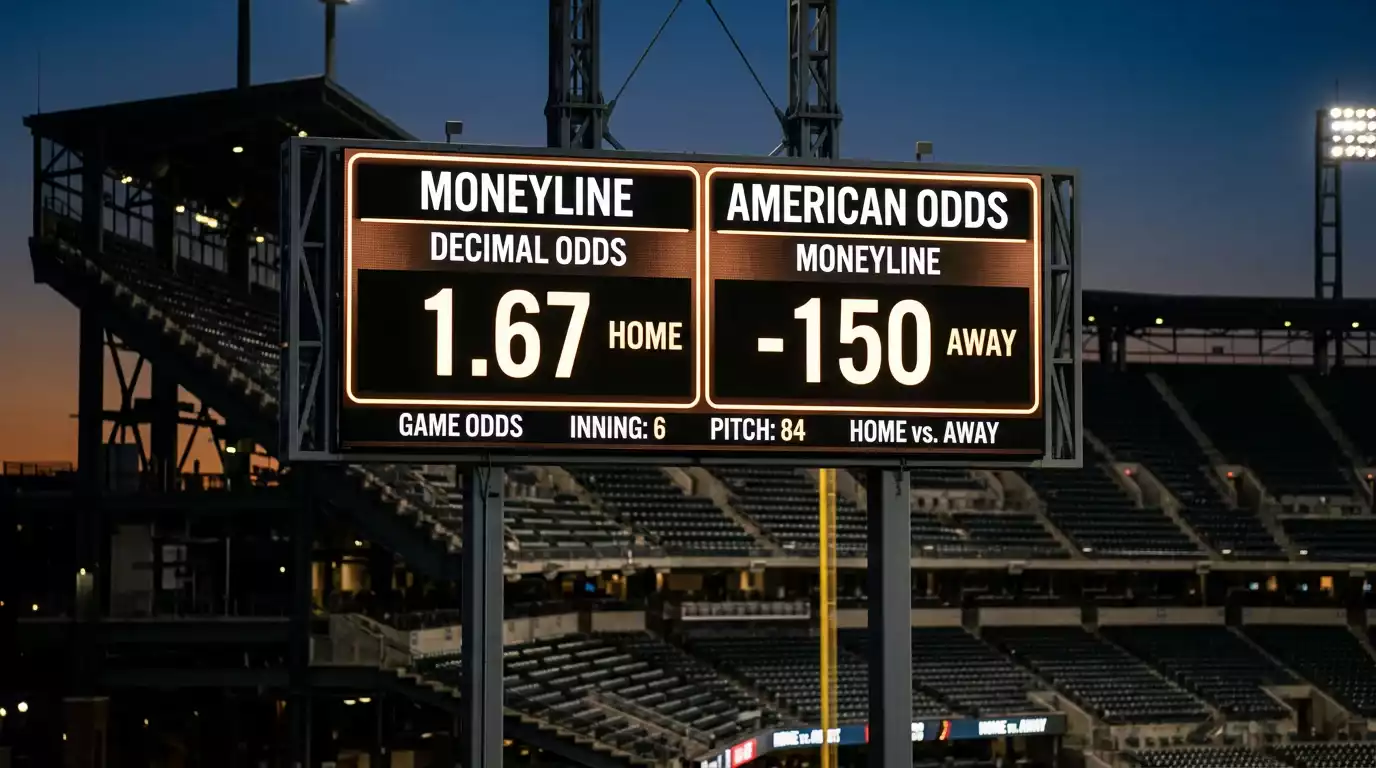
Closing line value, in plain terms, is whether the price you bet was better than the price the same market settled at just before first pitch. If you backed a team at 2.10 and the line closed 2.00, you got positive CLV – your bet went in at a number the market later judged generous. If you backed it at 2.10 and it closed 2.20, your CLV was negative – the market moved against you, suggesting you were on the wrong side of fresh information.
What CLV Actually Means in an MLB Context
CLV measures whether your bet beat the market’s final read on the same outcome. The closing line is treated as the wisest version of the price because by first pitch the market has absorbed every public report, every sharp move, every weather update, every lineup announcement, every late scratch. If you systematically bet at numbers more favourable than the close, your decision-making is, on average, beating the consensus that took the market all day to reach.
This is different from short-term ROI in one critical way. ROI is the dollar-on-dollar return of a finite set of bets – and over a small sample, it tells you almost nothing because MLB variance is enormous. A bettor with positive CLV and negative ROI over a month is likely on the right path; the math just has not had time to express itself. A bettor with negative CLV and positive ROI over a month is on a coin-toss run that will end. Pros watch CLV. Recreational punters watch ROI. That divergence is, in my experience, one of the biggest predictors of who will still be betting baseball in five years.
For MLB specifically, CLV applies to almost every two-way market. Moneylines close. Run lines close. Totals close. F5 markets close on their own clock. Player props close. The mechanics of measurement are identical across all of them – only the volatility differs, with props closing later and moving more on lineup news than main lines do.
Why CLV Matters More Than Win Percentage Over a 162-Game Season
About 30% of all MLB games are decided by a single run. That single statistic explains why short-term win percentage is such a poor proxy for skill. A run line bet on the favourite at -1.5 either wins by two or loses; whether the favourite wins the game by one run or by three is the difference between push and cash, and that knife-edge happens hundreds of times per season. Variance dominates short-run results. The same bettor, betting the same inputs, can finish July at +12% and August at -9% without changing a single line of his process.
July 2025 produced a stark example. Home underdogs that month returned $2,536 in profit on a flat-100 staking basis – a 20.6% ROI, the second-best monthly result for that bet category in the modern era after July 2016. Most bettors who rode that wave attributed the outcome to skill. The bettors who knew their CLV could check: did they actually beat the closing line on those home dogs, or did they just happen to be on the right side of variance? In my own tracking, the home-dog plays that summer hit positive CLV roughly 60% of the time – which is excellent – but no skilled bettor I know thought a 20.6% monthly ROI was their true edge. The skill was the +1.5% CLV margin. The 20.6% was variance dressed up as competence.
This is the single biggest reason I push UK punters to track CLV from day one. You do not need a hundred bets to know whether your CLV is positive. You need maybe twenty-five. ROI signal takes far longer – sometimes a full season – to separate from noise.
How to Calculate CLV: The Math Is Simpler Than You Think
The cleanest CLV calculation works in decimal odds and converts the result to a percentage edge. Take your bet price as decimal. Take the closing price on the same market as decimal. Divide your bet price by the closing price. Subtract one. Multiply by 100. That is your CLV in percentage terms.
Example: I bet Yankees -1.5 run line at 2.20. By first pitch the same market closed at 2.00. CLV equals 2.20 divided by 2.00, which is 1.10, minus 1, which is 0.10, times 100, which is +10%. That is a strong positive CLV result. A line moving from 2.20 to 2.00 on the same side means the market grew more confident in the side I backed; I got in before the move; my CLV is +10%.
Opposite example: I bet the same Yankees -1.5 run line at 2.00. By first pitch it closed at 2.20. CLV equals 2.00 divided by 2.20, which is 0.909, minus 1, which is -0.091, times 100, which is -9.1%. The market moved against my side. I got worse-than-close pricing. My CLV is negative.
For implied-probability fans, you can do the same math in probability terms. Your implied probability minus the closing implied probability equals your CLV in percentage points. Both methods yield the same conclusion about whether you beat the close. I prefer the decimal-ratio version because it scales cleanly across long and short prices, while the percentage-point version compresses on long-odds props.
Add a vig adjustment if you want sharper measurement. Devig both prices proportionally before running the ratio. The result is your CLV against the book’s true belief at close, not against the public-facing margin-loaded price. For most UK punters, the unadjusted ratio is enough – small directional differences do not change the verdict on whether your process is positive-CLV.
Typical MLB Line-Movement Patterns You Can Read
Lines move for a small set of reasons in baseball, and learning to read those reasons turns CLV from a backward-looking metric into a forward-looking signal. The opener – the first number released, usually the night before or twelve to fourteen hours pre-game – gets adjusted within minutes by sharp money looking for early value. Books that release early tend to take a beating on that first batch of bets. The number shifts. By morning the line has typically already moved one or two cents toward equilibrium.
Public action arrives in waves through the day. The biggest single move is usually mid-afternoon UK time, which is morning Eastern, when American bettors come online. The line shifts toward the public-favoured side, opening value windows on the contrarian side that sharp money then closes back down. By late evening UK time, with a few hours to first pitch, the market has been pushed and pulled in both directions and is approaching its consensus number.
Late-pitcher news – a scratched starter, a swap, a delayed warm-up routine – produces the most violent line movement in the final two hours. A scratched ace can shift a moneyline from -150 to -110 in minutes. Weather updates do something similar to totals: a confirmed 18 mph out-blowing wind in a hitter-friendly park can move a total from 8.5 to 9 in fifteen minutes. UK bettors with positions already on the board feel these moves directly through CLV; bettors with positions yet to take feel them as the market closing the value window.
Building a CLV Tracking Sheet That Tells You Something Useful
The simplest spreadsheet that actually works has nine columns. Date. Game. Market type, meaning moneyline or run line or total. Side. Bet price as decimal. Closing price as decimal. Result. CLV percentage. Stake. Track twenty-five bets and you can already see a directional pattern. Track a hundred and you can break the data down by market type – many UK punters discover their moneyline CLV is positive while their player-prop CLV is negative, which is a clear signal to either improve the prop inputs or stop betting props until they do.
I review my own CLV sheet every Sunday evening. A weekly rhythm catches drift before it becomes a habit, and gives you a feedback loop short enough to course-correct without being so short that you over-react to a five-bet stretch.
For UK punters who want to push beyond simple CLV measurement into the upstream signal that drives line movement, I would point you to a closer look at how to read MLB line movement and identify sharp money in real time. The link between CLV and reading the market is direct: bettors who get positive CLV consistently are usually bettors who have learned to read where the line is heading before the market gets there.
What Positive CLV Looks Like – and What to Do With It
A positive-CLV bettor over a season-long sample is, by definition, beating the market. That does not mean profitable every month – variance ensures losing weeks even with a strong long-run edge – but it does mean the math will eventually express itself. Most UK punters who get serious about CLV find their results improve not because they bet more games, but because they skip more games. The bet that does not beat the closing line should not have been a bet at all. Tracking CLV is the discipline that teaches you which entries are real edges and which are coin-tosses dressed up as conviction.
How much positive CLV should I aim for in MLB?
A sustainable target is +2% CLV per bet on average across a season-long sample. Above 5% is rare and usually means you are betting markets the rest of the field has not caught up to – a temporary advantage, not a permanent one. Below 1% you are essentially flat against the close, which means your edge is in skill of bet selection rather than in beating the market price. Either can be profitable, but +2% CLV is the cleanest measurable signal.
Does CLV apply to F5 markets and props the same way?
The math is identical but the volatility is not. F5 markets have a separate closing clock and tend to close on the same first-pitch trigger as the full game, so the calculation matches. Player props close later and move more dramatically on lineup news, which means a punter with positive CLV on main lines can have negative CLV on props if he is slow to react to late lineup announcements. Track them separately.
Published by the Betting Tips for Baseball team.