MLB Park Factors Data: Weather Conditions and Betting Totals
MLB Stadium Data: Adjusting Totals for Weather Conditions
A Saturday in May, six years ago — Wrigley Field, 88 degrees Fahrenheit, the flag on the centre-field pole pointing dead out toward Lake Michigan with the kind of stiff insistence you only see on real wind days. The total opened at 8.5. I backed the Over at 1.91 and watched a 13–8 final. That was the day I stopped treating mlb park factors and weather as background noise and started treating them as two of the highest-value, slowest-priced inputs in baseball betting. Sudden weather changes at places like Wrigley Field can trigger massive MLB line movement and sharp money action right before the first pitch.
The market reacts to weather and park context with a lag. Pitcher news moves prices within seconds — a scratch announcement at 4pm London time hits the line by 4:01. Weather moves prices over hours, and sometimes not until first pitch is imminent. Park factors barely move at all, because they are baked into the season-long pricing model and nobody re-prices Coors Field’s altitude on a daily basis. That lag is the punter’s edge.
This piece breaks down the entire framework — what a park factor actually measures, why Coors Field is its own pricing universe, which other stadiums tilt the totals math meaningfully in each direction, how temperature and wind quantitatively shift the expected run total, what humidity and rain delays do to your slip, and how I personally apply weather adjustments to a 9pm UK first-pitch totals bet that I am pricing from a sofa in London. The aim is not to make you a meteorologist. The aim is to give you a workflow that converts publicly available weather data into a directional edge against a totals line that is not pricing the data fully.
What is park factor
A park factor is a multiplicative number that captures how a stadium’s physical characteristics tilt run production relative to a league-neutral baseline. Centre it at 1.00 — that is the neutral park. A park factor of 1.10 means runs are scored 10% more often than at a neutral park, all else being equal. A park factor of 0.92 means 8% fewer runs.
The calculation usually compares runs scored in a stadium to the same teams’ run production on the road. If the Rockies score 5.2 runs per game at home and 4.1 on the road, and their opponents score 4.8 at Coors and 3.9 elsewhere, Coors Field has a park factor north of 1.20. That number is not a forecast for a single game. It is the long-term average effect across many games, many lineups, many starters. For any single matchup, the park factor is a baseline that gets adjusted up or down by weather and the specific pitcher-batter combinations on the day.
Park factors split into three broad categories. Hitter’s parks — Coors, Great American, Yankee Stadium, Citizens Bank, Fenway — boost run production. Pitcher’s parks — Petco, Oracle, T-Mobile, Tropicana, Comerica — suppress it. Neutral parks — most of the rest — sit close to 1.00 in either direction.
The reasons each park tilts the way it does are physical. Dimensions of the outfield (shorter walls give up more home runs). Wall height (the Green Monster in Fenway turns singles into doubles and doubles into home runs and home runs into wall-balls). Altitude (less air resistance means balls travel further). Foul-territory size (more foul territory means more outs on lazy foul balls that would land in the seats elsewhere). Wind patterns specific to the stadium’s geometry and surrounding architecture.
For betting purposes, park factor matters most for totals. A 9.5 total at a 1.10 park behaves differently from a 9.5 total at a 0.95 park, even if the starters and lineups are similar. The market knows this and prices accordingly — totals at Coors open higher than totals at Petco. The question is whether the market has priced the park factor correctly, or whether the day-specific conditions push the true expected total further in the same direction than the line acknowledges.
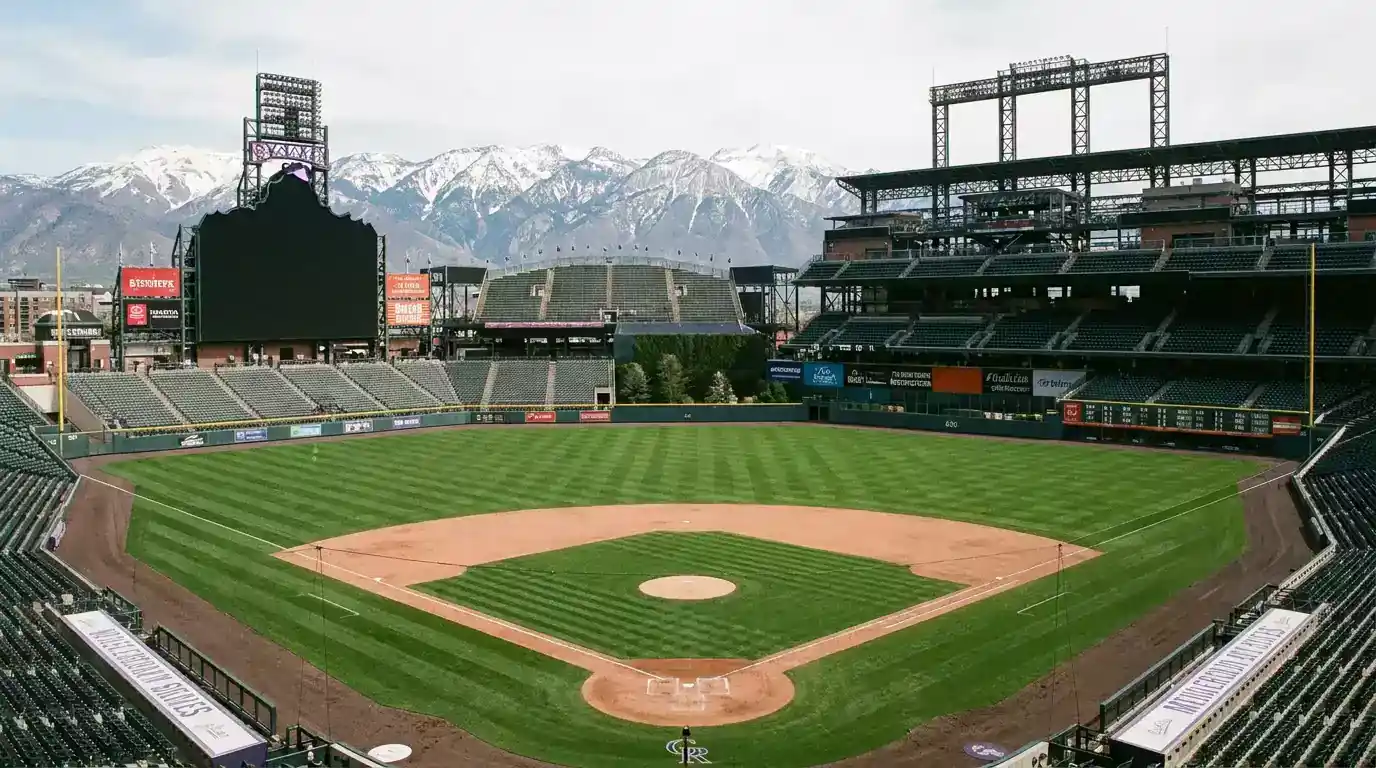
Coors Field and altitude
Coors Field is a category of one. Sitting at 5,280 feet above sea level — a literal mile up — it is the highest stadium in Major League Baseball by a margin that matters physically. At that altitude, air density is roughly 17% lower than at sea level. A batted ball travels approximately 5% farther than the same swing produces at sea level. That is not folklore — it is fluid dynamics, and you can see it on the spray charts.
What 5% more distance means in baseball terms — fly balls that die on the warning track in Boston clear the wall at Coors. Doubles into the gap become triples because the outfielders cannot cut them off. Routine pop-ups carry. Pitchers cannot get the same break on their curveballs because the lower air density resists less, so the spin axis bites less. Sliders flatten. Sinkers hold their plane longer. The pitcher’s full arsenal degrades, and the hitters’ attacks all play up.
The totals impact is visible in the line. A regular-season game at Coors Field typically opens between 11.0 and 12.5 — sometimes higher. The same matchup of the same two starters at Petco Park would open between 7.5 and 8.5. That four-run gap is the market’s attempt to price the altitude effect. Whether it prices it correctly depends on the day-specific conditions on top of the baseline altitude.
The variable that complicates Coors is the humidor. Since 2002, the Rockies have stored game balls in a humidity-controlled environment to counteract the ball-drying effect of the dry mountain air. Pre-humidor Coors was even more extreme than post-humidor Coors — the league-average park factor sat near 1.30 in the late 1990s. The humidor brought it down to roughly 1.15 to 1.20, where it has stayed for the past two decades. That is still an enormous tilt toward hitters, but it is meaningfully smaller than the unconstrained altitude effect would produce.
Humidor effect at Coors
The mechanism is straightforward — a baseball stored in dry air loses moisture and becomes lighter, harder and more aerodynamic. A lighter, harder ball travels further off the bat and breaks less off the pitcher’s hand. The humidor stores balls at controlled humidity and temperature, keeping the ball at a more standardised mass and elasticity than mountain ambient conditions would produce.
For UK punters pricing a Coors Field total, the humidor is already in the line. The bookmaker’s pricing model assumes the humidor is running. The day-to-day question is whether the specific conditions on the day amplify or dampen the baseline Coors effect. A 30-degree-Celsius day with the wind blowing out at Coors pushes the total even higher than the 11.5 opening — possibly to a true expected value of 13.0 or more. A 16-degree, drizzly day with the wind blowing in pushes it back closer to 9.5.
One practical note — the humidor is now used at several other parks too, including Tropicana Field and Chase Field, where local climate considerations argued for similar storage. The effect at those parks is smaller because the local air is closer to the ball’s storage humidity, but the principle is the same. Whenever a park introduces or modifies its humidor regime, it takes the market four to six weeks to price the new equilibrium, and that adjustment window is one of the cleaner sources of totals value in the regular season.
Other hitter-friendly parks
Coors is the headline, but four or five other parks tilt enough toward hitters to matter for totals work. Knowing which ones lets you anchor your day-to-day analysis without re-deriving the park-factor maths from scratch.
Great American Ball Park in Cincinnati is the second-most extreme hitter’s park most years. The dimensions are modest, the wind patterns favour fly balls carrying out to right and left field, and the elevation is mild but non-trivial at 482 feet. The home-run factor at Great American consistently runs 10% to 15% above league average. Totals at Great American open about half a run higher than the equivalent matchup at a neutral park.
Yankee Stadium is famous for its short right-field porch — 314 feet down the line, with a low wall. Left-handed power hitters punish that corner mercilessly. The Yankee Stadium park factor runs around 1.05 to 1.08 depending on the year and the wind patterns, with the home-run component carrying most of the lift. Right-handed power has a tougher time because left field is more conventional.
Citizens Bank Park in Philadelphia is another short-corner park, this one symmetric. Both lines play short — 329 and 330 feet — and the wall heights are modest. Combined with the typical Philadelphia summer humidity, Citizens Bank consistently runs as a top-five hitter’s park.
Fenway Park is the strangest of the major hitter’s parks. The Green Monster — the 37-foot left-field wall — turns deep flies into doubles off the wall, line drives into singles, and routine flies into wall-balls. The right-field foul pole is just 302 feet away. Fenway as a whole runs hitter-friendly, but the directional split is unusual — left-handed hitters pulling to right field get rewarded; right-handed hitters often see what should have been home runs converted into long singles.
Camden Yards in Baltimore is the most recent addition to the hitter-friendly list. The 2022 wall changes were intended to suppress home runs, and they did — but the effect partially reversed in 2024 and 2025 as hitters adjusted approach. The current park factor sits just above 1.00, mildly hitter-friendly, which is a meaningful shift from where the market was pricing it through the 2020 to 2023 window.
Pitcher-friendly parks
The pitcher-friendly side of the ledger has its own clear group, anchored by Petco Park in San Diego. Petco runs as the most pitcher-friendly park in baseball most years, with a park factor around 0.92 to 0.95. The combination of marine layer humidity that suppresses ball flight, deep power alleys, and high foul ground in some sections all contribute. Totals at Petco open between half a run and a full run lower than the equivalent matchup at a neutral park.
Oracle Park in San Francisco is the runner-up most years. The right-field wall is famously distant, and the Bay-side cold and damp suppresses fly-ball carry from April through June. Triples are common; home runs are rare unless the wind cooperates. Oracle’s park factor typically runs 0.93 to 0.96.
T-Mobile Park in Seattle is another marine-influenced pitcher’s park. The retractable roof complicates the analysis — when the roof is closed, the air is still and slightly dehumidified, which actually helps the ball carry. When the roof is open and there is onshore flow, the air is heavy and the ball dies. Always check the roof status before pricing a T-Mobile total.
Tropicana Field in Tampa Bay is the dome that consistently plays pitcher-friendly, though for different reasons. The dome height and the catwalks above create a uniquely deadened environment for fly balls. Hitters complain about it; pitchers love it. The park factor sits around 0.94 most years.
Comerica Park in Detroit and loanDepot Park in Miami round out the genuinely pitcher-friendly group. Comerica’s deep dimensions to centre and left-centre swallow up fly balls. loanDepot’s combination of cavernous geometry and humid air consistently runs as one of the lowest-scoring parks in the league. Totals at any of these five parks should open in the 7.5 to 8.5 range absent unusual conditions, and any line that opens higher than that warrants a hard look at why.
Temperature and runs
Here is a stat I keep front of mind every time I price a totals bet — at temperatures of 80°F (27°C) and above, the average MLB team scores 4.7 runs per game. At temperatures below 60°F (15°C), the same average drops to 4.2 runs per game. That is a half-run swing in expected scoring per team, which translates to roughly a full run on the total when both teams are factored in. The market knows this exists. The market does not always price it accurately.
The physics behind the effect is straightforward — warm air is less dense than cold air. A ball travels farther through warm air. The Magnus effect on breaking pitches is slightly different in warm versus cold air, though the carry effect on fly balls is the dominant signal. Combined with the fact that hitters’ hands and grips work better in warm weather and pitchers’ breaking balls bite less, the run-scoring environment tilts upward as the mercury climbs.
A Dartmouth study quantified the longer-term effect — rising baseline temperatures across the league have produced an estimated 500 additional home runs since 2010 attributable purely to warming. That is the climate-trend story, but the day-to-day implication is the same. Warmer games score more runs. Colder games score fewer. The closing line lags the day’s forecast by hours, sometimes by an entire day, which means an early-week 88°F forecast for a Friday game is not yet in the line that you can bet on Wednesday night.
The practical threshold I use — when the forecast for first pitch is above 80°F (27°C), I lean Over by default and look for confirmation in wind direction and park factor. When the forecast is below 60°F (15°C), I lean Under and look for confirmation. Between 60°F and 80°F, temperature is neutral and I let pitching and park drive the call. The April-and-October games at northern parks are the most aggressive Unders on the calendar — Wrigley, Citi Field, Citizens Bank, Camden, Comerica all play meaningfully smaller when the air is in the high 40s and 50s.
Two further notes. First, dome stadiums are temperature-independent — Tropicana and Globe Life and Chase (when closed) are not affected by ambient conditions. Second, the temperature-runs relationship is roughly linear, not stepped — every degree warmer adds a tiny fraction of a run to expected scoring, and the cumulative effect over a five-degree shift is meaningful even if it never crosses the 60/80 thresholds.
Wind direction and totals
Wind is the most underpriced single variable in MLB totals work. When the wind blows out of the stadium at 15 mph or more, the expected run total shifts by 1 to 2 runs in the Over direction. When the wind blows in at the same speed, the shift is roughly the same magnitude in the Under direction. That is a one-to-two-run move on a market that often sits at a 0.5-run granularity — meaning a single forecast change can flip the correct side of the line.
The mechanism is physical and intuitive. A ball hit on a 30-degree launch angle travels through the air for four or five seconds before landing. During that time, the wind acts on it continuously. A 15 mph tailwind adds 30 to 40 feet of carry to a ball that would have travelled 380 feet on a calm day. That is the difference between a warning-track flyout and a home run.
The direction matters as much as the speed. Wind blowing straight out toward centre field is the most extreme Over scenario. Wind blowing across the field — left-to-right or right-to-left — affects pull-side power asymmetrically; left-handed hitters get a boost, right-handed hitters get suppressed, or vice versa. Wind blowing straight in is the Under-friendly mirror. Wind that swirls or shifts direction during the game adds variance without a clear directional tilt.
Forecast accuracy is the practical constraint. Wind forecasts for a specific outdoor venue are accurate at three-hour resolution within roughly 24 hours of first pitch. Beyond that window, forecasts get less reliable, especially in stadiums with complicated local geometry. I tend not to bet weather-driven totals more than 24 hours in advance because the wind component is the one that can change meaningfully in the final hours, and a bet placed Tuesday morning for a Wednesday night game might be working from an obsolete forecast.
Open-air stadium architecture also creates wind anomalies that the general forecast does not capture. Wrigley Field, where the lake-effect wind off Lake Michigan creates dramatic day-to-day swings, is the headline example. Oracle Park’s bay-side wind tends to carry left to right. Marlins Park has a closing roof that the team uses tactically. The base rate of a 15 mph wind producing a 1-to-2-run shift is roughly the same everywhere, but the predictability of the wind itself varies wildly by stadium.
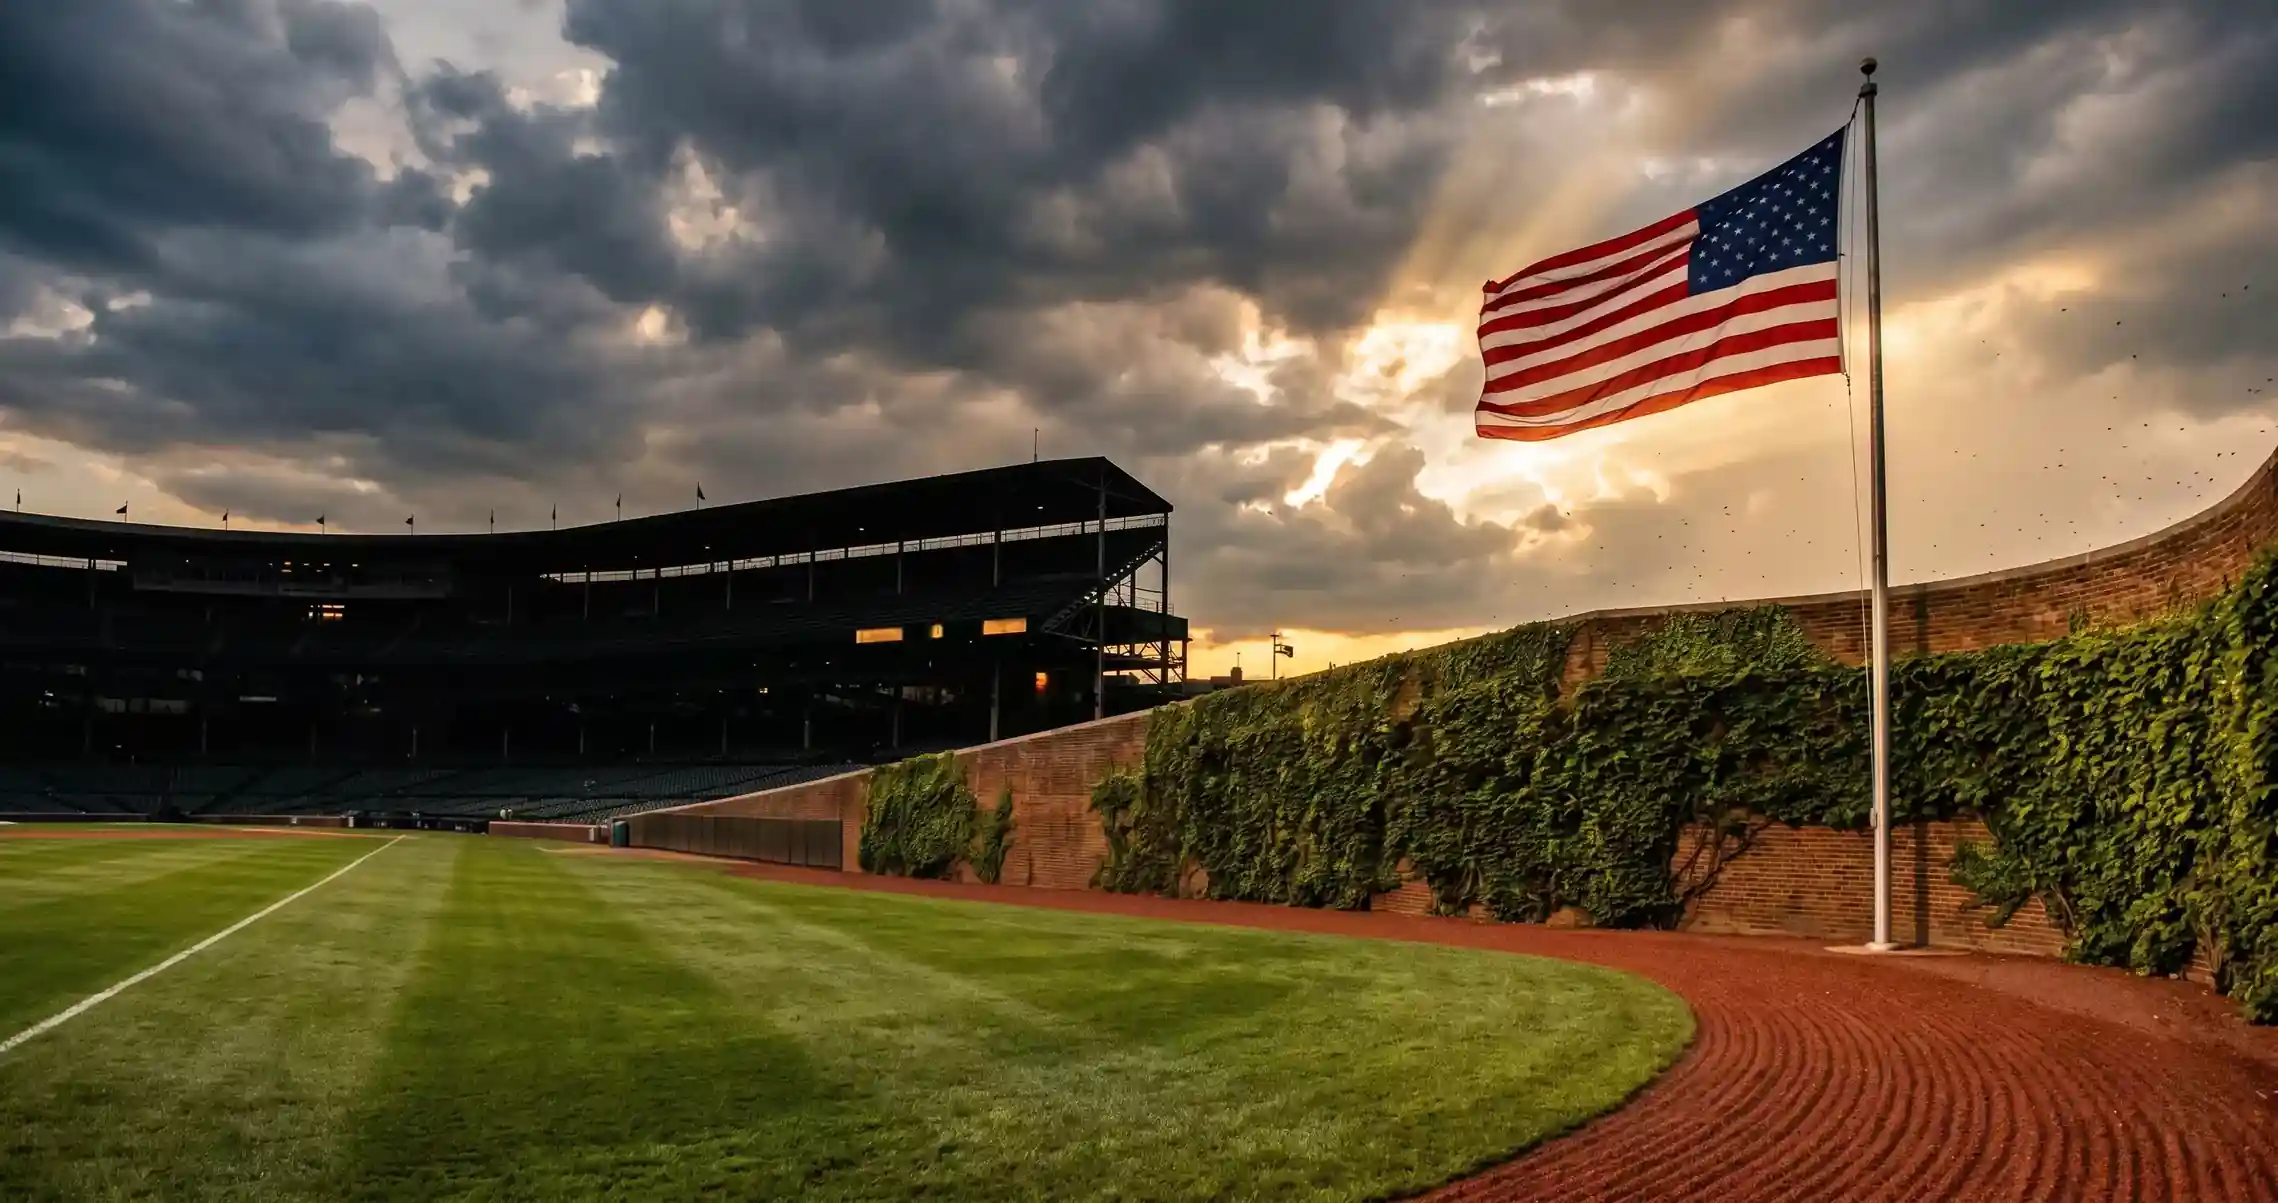
Wrigley Field — when the flag matters
Wrigley Field is the canonical wind-driven park, and the centre-field flag is the most-watched piece of cloth in baseball analytics. The reason is geography — Wrigley sits roughly a mile west of Lake Michigan, with a relatively unobstructed approach for east-to-west winds. When the lake breeze pushes the air inland, the wind blows in from centre and the park plays as a pitcher’s haven. When the prairie wind reverses and the breeze pushes east toward the lake, the wind blows out and Wrigley becomes one of the highest-scoring environments in the league.
The shift can be dramatic. Wind blowing in at 15+ mph at Wrigley turns the totals expectation into something close to a small ballpark — a 7.5 line becomes correct, where the same matchup with the flag stationary would have been 8.5 or 9. Wind blowing out at 15+ mph creates the inverse — totals that should price at 10.5 are often sitting at 8.5 or 9 because the line was set hours before the forecast firmed up.
The practical workflow at Wrigley — check the wind forecast for first pitch, check the wind direction (out toward left, centre, or right; or in from those directions), and decide whether the total is mispriced. The afternoon flag-watching tradition that the Chicago broadcast crews mention is not romantic colour. It is genuine actionable information, and it is one of the cleanest sources of late-line value in the regular season.
Humidity, precipitation and rain delays
Humidity has a smaller and less intuitive effect than most punters expect. The popular myth is that humid air helps the ball carry. The physics says the opposite — humid air is actually slightly less dense than dry air at the same temperature, because water molecules are lighter than nitrogen and oxygen molecules. So humid air should help carry, marginally. But the magnitude is tiny compared to temperature and wind, and humidity matters mostly through its effect on the ball itself and on player performance rather than through the air.
A wet ball is harder to grip. Pitchers struggle to spin breaking pitches in high humidity. Hitters’ bats can be slippery in their hands. These secondary effects partially cancel each other out and the net impact on run-scoring is small enough that I rarely factor humidity directly into a totals call. The exception is the extreme — 85%+ humidity with no rain, common in summer night games at Houston, Tampa Bay (when the roof is open) and Miami. In those conditions, run scoring tends to creep up slightly, though not by a margin that overwhelms park and pitcher.
Rain is the bigger variable for slip settlement. A rain delay does not in itself void a bet — the game can resume after the delay and the slip plays through. But a game that gets called because of weather is settled in one of two ways. If the home team is winning at the end of the bottom of the fifth inning, or after the top of the sixth inning regardless of score, the game is “official” and all bets settle on the score at that point. Anything before that and bets are voided and stakes returned, though some operators have small variations in this rule.
The implication for totals is brutal. You back an Over at 8.5, the score sits at 4-2 in the fourth, rain comes, the game is called — the bet is voided, and you get your stake back, not your winning slip. That sounds like a fair outcome until you realise the Over at 8.5 was getting there. Check the weather forecast for first pitch through completion, not just the moment the ball leaves the pitcher’s hand.
Applying weather to a totals bet
Let me walk through a real workflow on a hypothetical Wrigley matchup, because abstract principles are useful only insofar as you can apply them on a Wednesday night with twenty minutes to go before first pitch.
The setup — Cubs vs Brewers at Wrigley, 7:05 pm local first pitch. The total opened at 8.5 with the Over priced at 1.91 and the Under at 1.91. Both starters have FIPs in the high 3s. Both bullpens are average. Neither lineup is exceptional. On a still day at a neutral park, that 8.5 looks correct.
Now the conditions. Forecast for first pitch — 88°F (31°C), wind out toward centre field at 18 mph, no rain expected. That is the setup that converts a neutral 8.5 into a screaming Over. Temperature above 80°F adds roughly half a run per team. Wind out at 18 mph adds 1.5 to 2 runs to the expected total. The combined effect pushes the true expected total to somewhere between 10.0 and 10.5, against an opened line of 8.5. That is the value play.
The check — has the line moved? If the Over has been bet heavily since the line opened, the price might be at 1.83 or shorter, and the line itself might have moved up to 9.0 or 9.5. That movement absorbs some of the value. The cleaner play is to catch lines before the public weather-watchers pile in, which usually happens in the final two hours before first pitch.
The pitching side complicates things. Max Scherzer put it best — “We’re thinking like robots instead of thinking like a human, and trying to make decisions based on another human being in a box. That’s the challenge of pitching.” A pitcher who knows the wind is blowing out will adjust his approach — fewer fastballs up, more ground-ball-inducing sinkers and changeups. A pitcher who is veteran-savvy can partially neutralise wind. A young starter who has never pitched in those conditions cannot. That nuance is the part of weather analysis that does not show up in any database, and it is why the totals call is never just the weather model — it is the weather model plus the pitchers’ likely response to those conditions. The discipline is using the model to find the spots, and then using the matchup analysis to confirm or fade the call.
For deeper analysis of how specific wind directions affect run-scoring at individual stadiums, the wind direction betting guide breaks down each park’s typical wind patterns and the price implications. Stay updated on daily weather impacts and stadium trends by checking our expert MLB betting predictions.
FAQ
Published by the Betting Tips for Baseball team.