MLB Spring Training Betting Mistakes: Why March Stats Lie
 Available in US
The Trap of the Premature Read
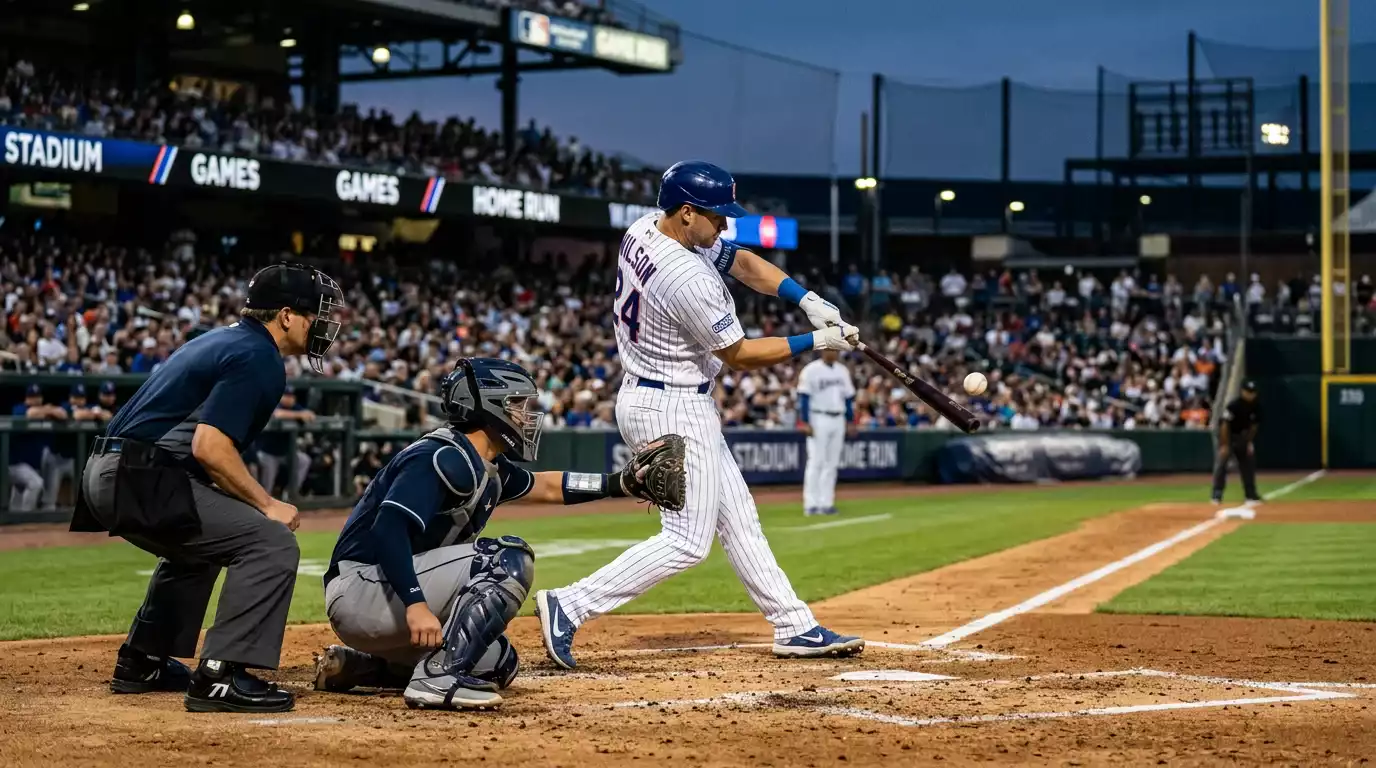
One March I was watching a top prospect bat .478 across his first ten spring training plate appearances. I read every breathless preview piece about how his swing had matured, his pitch recognition had improved, and his rookie season was about to be historic. I placed an early-season prop bet on him to hit 30 home runs before the All-Star break. The numbers had me convinced. By mid-May he was hitting .218 in the minors after a brief and unsuccessful big-league call-up, and my bet was dead before the cherry blossoms had finished in St. James’s Park. The lesson was clear and expensive. Spring training statistics do not predict the regular season, and the betting markets that price spring outcomes are precisely the markets where the recreational money loses the most reliably.
For UK punters approaching their first full MLB season, the temptation to engage with spring training is real. The British baseball calendar is barren through February and early March, the off-season is long, and the first exhibition games in the Grapefruit and Cactus Leagues feel like the start of something. The danger is that engaging with March markets without understanding their structural noise produces predictable losses that bleed into your regular-season bankroll. This article exists to keep you out of those losses.
What Spring Training Actually Is
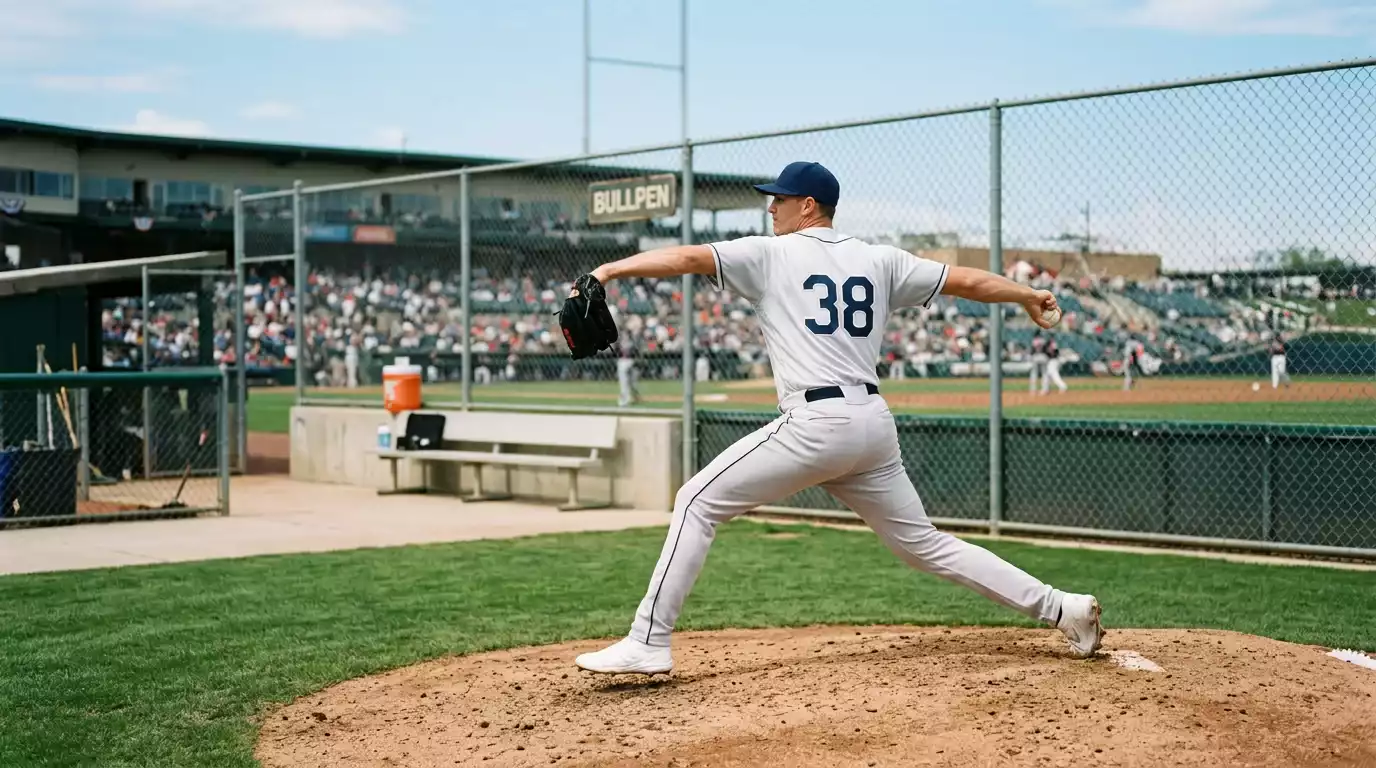
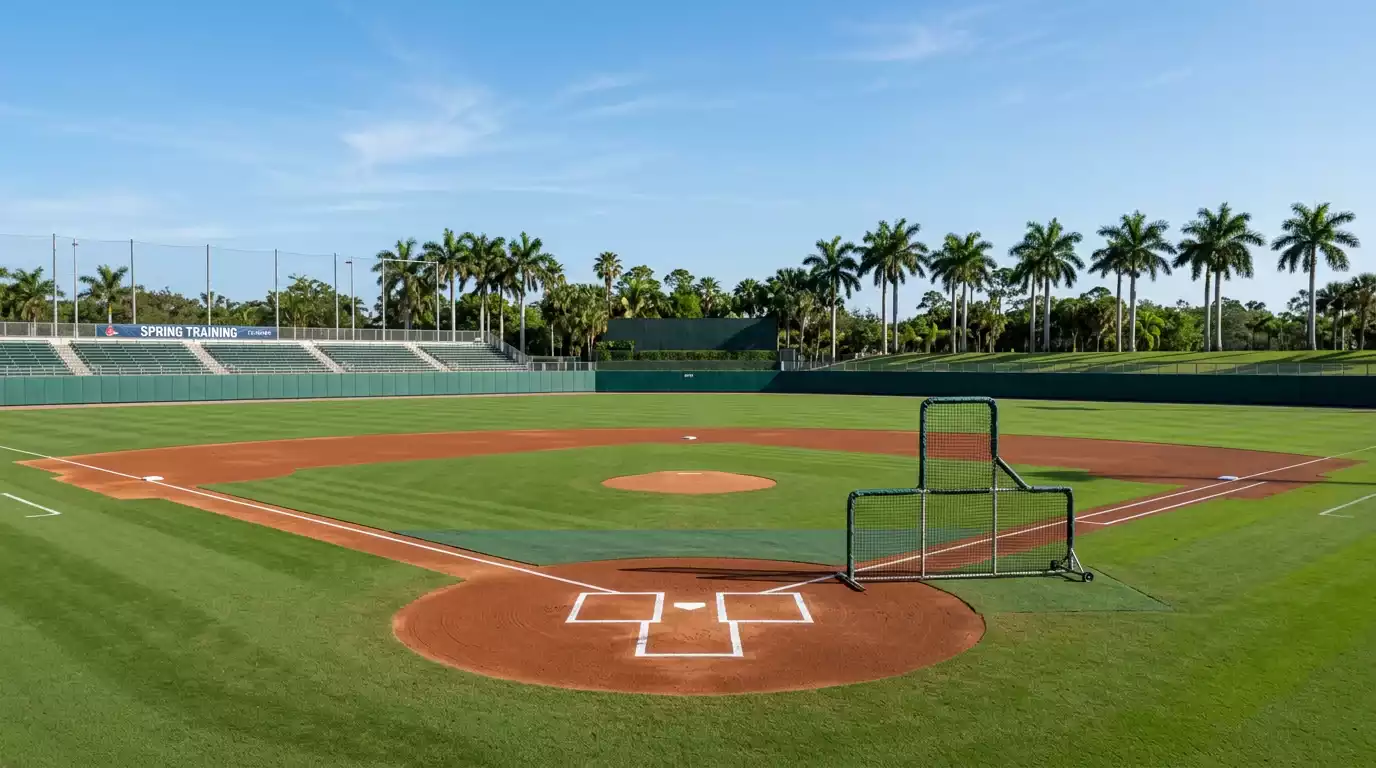
Spring training in MLB is split across two regional leagues. The Grapefruit League runs in Florida and includes most of the East Coast clubs. The Cactus League runs in Arizona and includes most of the West Coast and Mountain Time clubs. Both leagues play roughly 30 exhibition games per team across late February and March, ending shortly before the regular season opens on the final week of March or the first week of April.
The fundamental point is that these are exhibition games. They do not count towards the regular-season standings. Their primary purpose is operational rather than competitive: pitchers build innings, hitters re-establish timing, managers experiment with lineup combinations, prospects audition for major-league roster spots, veterans work through specific mechanical projects with coaches. The competitive intensity is real but it sits below the level of regular-season games, and the rules around player usage reflect that lower stakes.
The bookmaker markets on spring training games are also a different category from regular-season markets. UK-licensed operators that carry spring training at all typically offer moneyline only, with reduced limits and wider margins than regular-season pricing. Some books skip exhibition games entirely. The market depth that supports active line-shopping in summer baseball simply does not exist in March, which means the few markets that are available are priced more conservatively from the book’s perspective and less competitively for the punter.
Why Spring Statistics Do Not Translate
The mechanism by which spring training stats fail to predict regular-season outcomes is structural and worth understanding properly. The biggest factor is opposition quality asymmetry. When a major-league starter pitches a March exhibition, his lineup typically faces a mix of legitimate big-league hitters and Triple-A prospects who would not see major-league at-bats during the regular season. When a major-league hitter steps to the plate in March, he frequently faces a Double-A or Triple-A pitcher rather than the rotation arms he will face in April.
This produces a systematic bias in offensive numbers. Big-league hitters look better against minor-league pitching than they will against major-league pitching. Major-league pitchers look better against weakened lineups than they will against full big-league hitting. Spring batting averages run higher than regular-season equivalents, and spring ERAs run lower than the same pitcher will produce in April. Importing those numbers directly into your regular-season projections will systematically over-rate hitters and over-rate pitchers – which produces incoherent betting positions when you try to back them against each other.
The field conditions add another layer. Spring training stadiums in Florida and Arizona play in conditions very different from most regular-season environments. The Florida humidity affects ball flight differently from the dry desert air of Arizona, and both differ from the conditions in the team’s home stadium in April. Mound construction quality varies across the smaller spring complexes, and the breaking-ball movement that a pitcher produces in March may differ materially from what the same pitcher produces in his regular-season home park.
Small-Sample Traps
Even setting aside the opposition quality issue, the sample sizes in spring training are far too small to support meaningful inference. A hitter who gets 25 plate appearances across the spring is operating at a sample where random variance dominates true talent. A pitcher who throws 12 innings across four exhibition starts has produced a sample where one bad inning can swing his ERA by two runs in either direction. None of these numbers are predictive in any statistical sense.
The recreational mind compounds the small-sample problem with selection bias. A hitter who goes 4-for-8 across his first two exhibition games gets written about. A hitter who goes 1-for-8 in the same window does not generate headlines. By the time a casual punter has consumed his off-season reading and seen the spring training previews, he has a strongly skewed sense of which players are “having a great spring” – and the players who hit the early headlines are the ones whose small-sample noise happened to land on the favourable side of variance.
The 2025 MLB season hammered home a related point about hitter-pitcher imbalance. Only 7 hitters across the entire major leagues finished the year with a batting average of .300 or higher, against an average of 22.1 such hitters per season across the 2010s decade and 39.7 per season in the 2000s. The league-wide batting average dropped to .245. The structural drift of the modern game towards pitcher-friendly conditions means a hitter looking strong in spring against soft pitching is even less predictive than a similar spring performance would have been a decade ago, because the regular-season hitting environment he is about to enter is materially harder than the spring environment.
Lineups Rotate Constantly
The operational reality of spring training also defeats serious line-shopping or matchup-betting strategies. Managers rotate lineups aggressively across the exhibition schedule to give every player on the 40-man roster meaningful at-bats. A starting pitcher might face an Opening Day-style lineup in his first inning, then watch his manager substitute three or four prospects into the field as the game continues. By the fourth inning of a spring exhibition, the lineup on the field bears little resemblance to what the same team will field on Opening Day.
The bookmaker books struggle to keep up with this volatility. A line that opens at -130 favouring one team based on the projected starting lineups can become structurally wrong within 90 minutes of first pitch when the manager substitutes out his core hitters. Some operators have responded by limiting in-play betting on spring games entirely. Others continue to offer in-play markets but at much wider margins to protect against rapid lineup degradation.
For punters, this volatility means that even the analytical work you might otherwise do – projecting how a lineup matches up against a particular pitcher – has a much shorter shelf life in spring than in regular-season games. Your pre-match projection becomes obsolete inside an inning. The right response is generally to step back from spring training betting altogether, or to limit your engagement to very specific tactical situations rather than running a full betting volume through March.
What You Should Actually Watch in Spring
The right use of spring training for a serious bettor is research, not active betting. There are specific signals from March that do carry predictive weight for the regular season, and they sit on the pitching side. An analysis of 2021 MLB data showed that pitching statistics – ERA, FIP, LOB%, WAR, WHIP, hits per nine, batting average against, saves – occupied 8 of the 10 top spots for correlation with team win percentage. The only purely offensive statistic in the top 10 was offensive WAR, ranking 9th. Pitching dominates win-percentage prediction in modern baseball, and the spring signals that matter are pitching signals.
Three specific things to track. First, pitcher velocity. A starter whose fastball velocity in spring is consistently 1-2 mph below his career baseline is showing a real signal – either he is working through a mechanical issue, dealing with an undisclosed injury, or arriving out of off-season conditioning. Velocity is the single most predictive spring data point and worth tracking obsessively for any pitcher you might bet against in April. Second, bullpen role clarity. The pitchers who are getting the high-leverage spring innings – eighth-inning work, save situations – are the ones the manager is signalling will hold those roles in the regular season. The bullpen depth chart that emerges from spring is usually the one the team starts the season with. Third, prospect call-up positioning. Prospects who are working with the major-league pitching coach, getting at-bats against major-league pitching, and travelling with the big-league club through the latter half of the spring schedule are positioning for early-season call-ups rather than full minor-league assignments. Those promotion timings are real betting inputs once the regular season starts.
The right discipline is to use spring as a reconnaissance phase. Build your read on the season ahead by watching pitcher health, bullpen roles, and prospect positioning. Save your actual betting volume for Opening Day onwards, when the structural noise of exhibition baseball gives way to games that matter. The work you do in March pays off in April and May, not in the spring markets themselves. When the call-up decisions do come and a top prospect joins the active roster mid-season, the betting markets respond in ways that are themselves worth understanding properly – the structural realities of how rookie debuts move betting lines deserve their own analytical framework.
Keeping Your Bankroll Out of March Trouble
The right spring training discipline for UK punters is simple. Treat the March markets as off-limits for serious betting volume. Use the exhibition schedule for research, scouting, and roster work. Watch pitcher velocity, bullpen roles, and prospect movement. Wait for Opening Day to deploy your real bankroll on the markets that are properly priced and properly populated. The bettors who lose money in spring training are not losing because they read the games wrong – they are losing because they engaged with markets that were never designed to be profitable for anyone. The discipline of staying out of those markets entirely is the single most valuable spring-training habit a serious punter can develop.
Are spring training futures odds ever worth betting?
Spring training futures – including divisional and World Series winners – can offer value but only in specific circumstances. The best windows are when an off-season free-agent signing, trade, or unexpected injury news has materially changed a team’s roster after the futures market opened. In those cases, the lag between event and market adjustment can produce genuine pricing edges. Generic spring futures placed simply because the off-season feels long carry no analytical edge and should be avoided.
Does spring K-rate predict anything?
Spring strikeout rate carries some weak signal but mostly only at the extremes. A pitcher with a dramatically elevated spring K-rate against major-league hitters may be showing a real stuff improvement. A pitcher with a dramatically depressed spring K-rate may be hiding a mechanical or health issue. Modest variations in spring K-rate within normal ranges contain too much sample noise to be useful for regular-season projection.
Published by the Betting Tips for Baseball team.