MLB Wind Direction Betting Guide: Reading Flags Before First Pitch
 Available in US
The Wrigley Saturday That Taught Me to Watch Flags
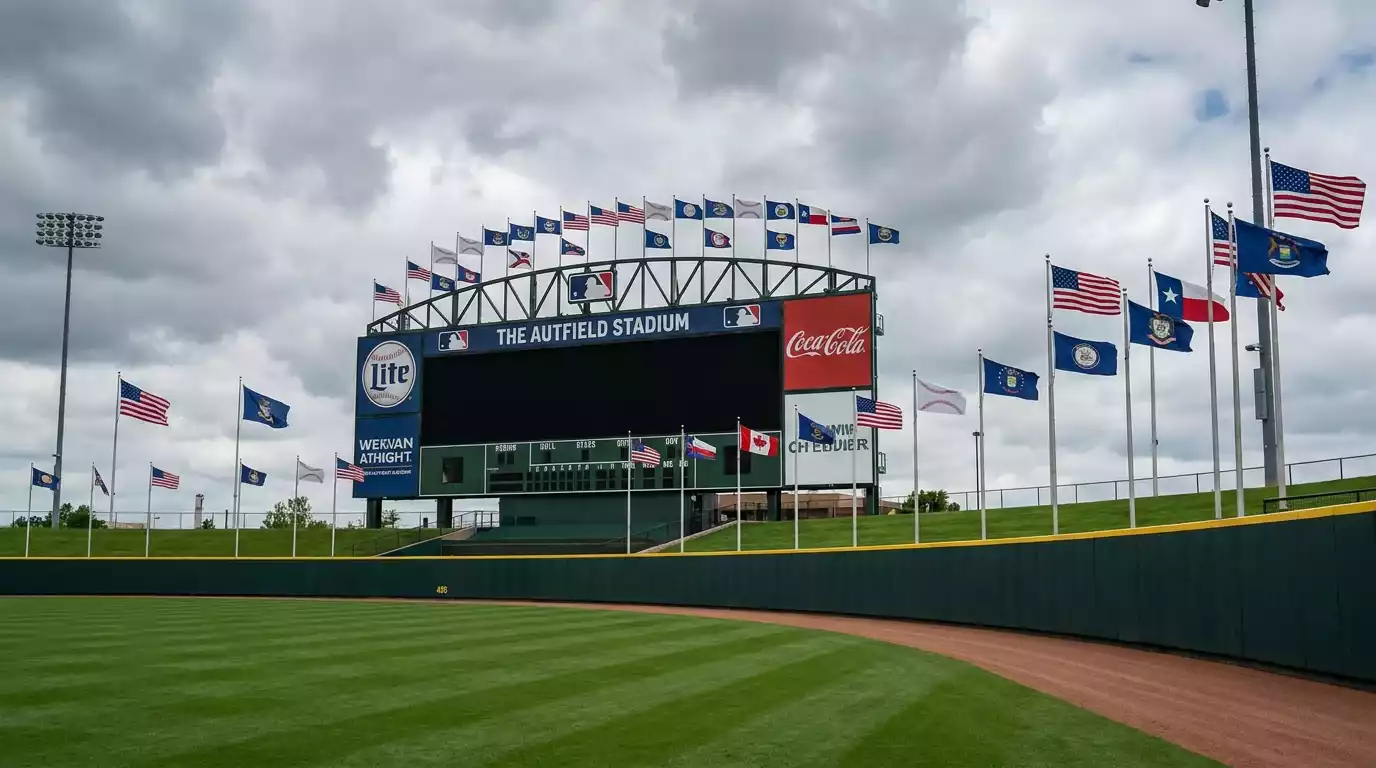
A Saturday afternoon at Wrigley Field in late May, I had bet the under on a Cubs game based on two solid starters and a forecast I had barely glanced at. By the second inning the camera kept cutting to the centre-field flags blowing straight out towards the bleachers in right-centre, and balls that I had expected to die on the warning track were carrying into the basket above the wall. The game finished 13-9. My under was destroyed. I went back and looked at the morning weather data I had ignored: a 17 mph wind out of the south-west, exactly the configuration that turns Wrigley from a pitcher’s park into a launching pad. That afternoon I built my first proper park-by-park wind table, and I have never bet a Cubs home game without checking the flag direction since.
Wind is the most underrated daily variable in MLB betting. At several specific parks, the prevailing wind direction on first-pitch day matters more to the run environment than any combination of starting pitcher, lineup quality or temperature. The recreational market frequently underweights wind forecasts because the information feels like meteorology rather than baseball – and the punters who do the wind work pick up edges that are systematic, repeatable and largely invisible to anyone betting from name recognition alone.
Why Wind Matters More Than Rain
Wind affects baseball more than any other weather variable that does not actually stop the game. Rain typically delays or postpones matches but does not materially change the run environment when games do play. Heat affects the run environment through ball flight and pitcher fatigue, but the magnitude is bounded. Wind, by contrast, can shift the totals expectation by one to two full runs on the basis of forecast direction and speed alone.
The mechanism is direct. A baseball hit at typical home-run trajectory has flight time of 4 to 6 seconds and travels 300 to 450 feet horizontally before landing. A 15 mph wind blowing in the direction of ball flight adds roughly 15-20 feet to that travel distance. A 15 mph wind blowing against the ball subtracts a similar margin. Home-run totals scale roughly linearly with carry distance at the margin between routine fly out and wall-clearing drive, which means wind direction sits as the single biggest day-of-game adjustment factor for over-under decisions at exposed parks.
The empirical evidence backs the physics. Studies of MLB run environments have shown that 15 mph or stronger winds blowing out from home plate towards the outfield correlate with 1-2 additional runs scored per game compared with the same matchups in calm conditions. Wind blowing in the opposite direction – towards home plate – produces an equivalent suppression of 1-2 runs. The effect is symmetric and applies at all open-air parks, though the magnitude varies by stadium configuration.
Wrigley Field and the Jet Stream
Wrigley Field is the canonical wind-affected MLB park, and for good reason. The stadium’s open-air configuration, its proximity to Lake Michigan, and the prevailing wind patterns of the Chicago summer combine to produce some of the most extreme single-day run environment shifts in baseball. The right-field flag at Wrigley is the most-watched piece of cloth in pre-match wind analysis, and the wind direction it reveals can swing totals lines by two full runs across a single afternoon.
The prevailing summer wind in Chicago blows from the south-west, which at Wrigley’s east-facing orientation translates to wind blowing out towards the right-centre field bleachers – the so-called jet stream that historically turns Wrigley into one of baseball’s premier home-run parks. When the jet stream is active, balls that would die at the warning track at any other ballpark carry into the seats. The over on Wrigley totals in those conditions is one of the highest-confidence positions a UK punter can take.
The opposite configuration matters equally. When the wind reverses and blows in from the lake – typically from the north-east on cooler days – Wrigley becomes one of the most pitcher-friendly parks in baseball. The same hitters who would launch fly balls in the jet stream send fly outs to the warning track. The under in those conditions is equally reliable, and the bookmaker books often lag in pricing the suppression because the recreational money continues to assume Wrigley plays as the historic launching pad regardless of daily conditions.
The right pre-match work for any Wrigley game is to check the forecast wind direction and speed in the three hours before first pitch, identify which configuration applies, and position the totals bet accordingly. The wind matters more than the starting pitcher matchup. The wind matters more than the lineup composition. The wind frequently matters more than every other factor combined.
Other Wind-Sensitive Parks
Beyond Wrigley, several other MLB parks produce wind-driven run environment shifts that UK punters should track. Camden Yards in Baltimore is open along the right-field warehouse line, and prevailing winds from the south-east push balls toward the right-field corner where the geometry favours home-run carry. Yankee Stadium has the famous short right-field porch that gets amplified or suppressed depending on wind direction across that specific section of the outfield. Citi Field in Queens sits in an exposed open configuration that produces meaningful wind shifts across the day-night spectrum of New York summer weather.
Fenway Park has the Green Monster in left field, which interacts with wind direction in non-obvious ways – wind blowing out to left can push routine fly balls into the wall or even over it, but wind blowing in suppresses both fly-ball carry and the line-drive doubles that the Monster typically generates. The combination is complex enough that simple direction-and-speed analysis at Fenway can mislead unless you have done deeper park-specific wind work.
San Francisco’s Oracle Park is the extreme cold-wind suppressor. The bay-side configuration produces consistent in-blowing winds that push the home-run rate to one of the lowest in baseball, and the prevailing pattern is consistent enough that the bookmakers price it correctly most of the time. The edges at Oracle come on the rare days when the prevailing wind pattern flips, and the recreational market continues to price the under as if the standard suppression is still in effect.
How Late Wind Forecasts Shift the Line
Wind forecasts have a specific volatility profile that distinguishes them from other betting inputs. The morning forecast for first-pitch wind conditions is meaningful but not reliable. The 11am or noon forecast for an afternoon game has a meaningful error band on both direction and speed. The 3pm forecast for a 7pm first pitch is much more accurate, but the bookmaker line typically has not adjusted by then because the volume of pre-match action has already established the closing-line consensus.
This produces a specific tactical opportunity. The window between roughly 90 minutes before first pitch and 30 minutes before first pitch is when meaningful new wind information often arrives – through real-time observations from the park, updated METAR weather reports from the local airport, or revised hourly forecasts. The bookmaker line on totals typically moves slowly during this window because the heavy recreational volume has already settled. A punter watching the wind forecast updates can sometimes position bets against a totals line that no longer reflects the most recent meteorological data.
The other line-movement pattern worth understanding is the late-day forecast volatility that affects evening games. A 4pm forecast might show calm conditions, but by 6pm a frontal system has rolled through and produced 18 mph winds in a direction not previously anticipated. The bookmaker line on the totals market typically adjusts within 30 to 45 minutes of the forecast revision, which is usually fast enough to capture the change before first pitch – but not always. The fastest-acting punters on weather volatility can pick up edges in those narrow windows when the market is lagging the meteorology.
Wind Stacking With Temperature
The compound effect of wind and temperature deserves separate treatment because the two variables interact non-linearly. League-wide MLB scoring runs at 4.7 runs per game when temperatures hit 80°F and above, compared with 4.2 runs per game at temperatures below 60°F. Wind blowing out in the direction of ball flight adds the additional 1-2 run effect on top of any temperature baseline. The stacked combination of hot weather plus out-blowing wind produces run environments materially higher than either factor alone would suggest, and the totals lines often fail to capture the full compound effect.
The opposite stacking is equally informative. Cold weather plus in-blowing wind produces some of the most pitcher-friendly conditions in baseball. Late-September night games at exposed parks like Wrigley or Camden Yards in 50°F temperatures with strong in-blowing winds can produce game totals that come in 3-4 runs below the closing line. Tracking the combined cold-plus-in-blowing-wind subset across recent seasons has produced one of the cleaner under-betting patterns at exposed northern parks.
The right pre-match process for wind-sensitive parks is to layer the wind effect with the temperature adjustment in sequence, then compare the compound projection to the bookmaker total. Material divergences are the betting opportunities. The natural complement to wind and temperature analysis is the deeper pitching-statistical work that separates true talent from variance-driven results, and the analytical framework around how FIP and ERA gap predicts line movement sits as the next layer for punters building a serious analytical model.
Making Wind Part of Your Routine
The right discipline for UK punters serious about MLB totals is to build wind into the pre-match research routine the way temperature already is. Check first-pitch forecast wind direction and speed for every game at Wrigley, Camden, Yankee Stadium, Citi Field and Oracle. Stack the wind read with the temperature forecast. Compare the compound projection against the bookmaker total. Bet the divergences. Most punters skip the wind entirely because the information feels meteorological rather than analytical. That gap is precisely where the systematic edge sits.
How accurate are MLB wind forecasts 3 hours before first pitch?
Wind forecasts in the 3-hour window before first pitch are meaningfully more accurate than morning forecasts, with direction error typically within 30 degrees and speed error within 3-4 mph for most exposed parks. The 90-minute window is sharper still, and observations from the park itself within 30 minutes of first pitch are essentially ground truth. The volatility of late-day frontal systems can still produce surprises, particularly for evening games in summer when convective weather is common.
Does roof state at retractable parks matter for wind?
Yes, materially. When a retractable roof is closed, the playing environment is climate-controlled and wind has no direct effect on ball flight. When the roof is open, standard wind direction and speed calculations apply. Tracking the roof state for stadiums like Globe Life Field, Marlins Park, Chase Field and others with retractable configurations is one of the more granular but more analytically useful pre-match data points for totals betting at those parks.
Written by the editors at Betting Tips for Baseball.